
For managers, one of the comforts of traditional performance management is that it is a well understood process, it's formal and orchestrated, and once it's done, there is a whole year (or at least 6 months) before HR bother managers about it again. Such comfort is one of the main obstacles preventing the shift to adoption of agile performance management.
It's understood by everyone that the measures from traditional approaches are highly inaccurate and the process itself is demotivating and ineffective, and yet managers remain hard to convince that a more regular but less onerous practice might give them a better return on time.
How should we measure when experts are discouraging looking backwards? What is measurable today when feeding forward means improving future performance?
The paradox is that we can get more frequent measures and more diverse measures through the increased frequency of check-in's or quality conversations providing that organisations have a system of engagement to keep track of them. Some organisations don't keep track though. They've sold executives and managers the change to agile performance management on the promise of little or no paperwork, and of saving management time from reduction in administration.
That is a wrong turn. Here's why.
As children journeying to a destination, we might have questioned 'are we nearly there yet'. In just the same way, the stakeholders in a business are consciously or subconsciously asking 'are we nearly there yet' about their particular mission at work.
Being able to measure progress and to show progress in near real time is the way to answer that, and in doing so to create confidence and ongoing buy-in from people to their commitments.
Building a sense of progress is essential to knowing how close you are to achieving your high performance culture. It's less about KPIs and more about engagement and appropriate behaviour.
We focus on 3 types of measurement to quantity that; metrics, trends and insights.
Metrics
Metrics are counts of things. Counting is easy providing you have data to count, and impossible if you don't.
The kinds of metrics that reveal if your check-ins and quality conversations are going well are participation rates, self assessment, feedback request levels, distribution of activity by business unit, geography, seniority level, job type and gender for example.
Metrics might be represented as a simple number, a league table, matrices or charts of various kinds.
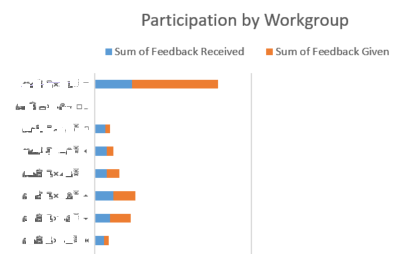
Example of participation metrics
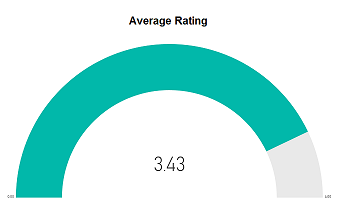
Example rating metric
The kind of metrics that show your people are on track are the lead indicators that foreshadow business success. For example, how often are your values evident in the interactions people have, or which of your people exhibit core beliefs that you know lead to business results? What do your satisfaction metrics look like such as Net Promoter Score (NPS), or Employee Net Promoter Score (eNPS), and how much progress is being made against personal growth objectives?
These are the signs of healthy people culture.
Trends
Trends are changes in metrics over time.
Any metric that you can consistently measure can be converted to a trend.
Trends show if metrics are improving or deteriorating compared to prior periods.
Why trends are important in Agile Performance Management is that they can also be extrapolated to provide forecasts of future performance.
Enabling managers and individuals to visualize trends as they happen helps your people to repeat actions that are successful and stop those that are not.
Trends might be displayed as icons such as up arrows and down arrows, sparklines, charts with a time axis, or even animations.
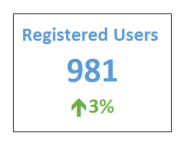
Example trend showing change in registered users this period vs last
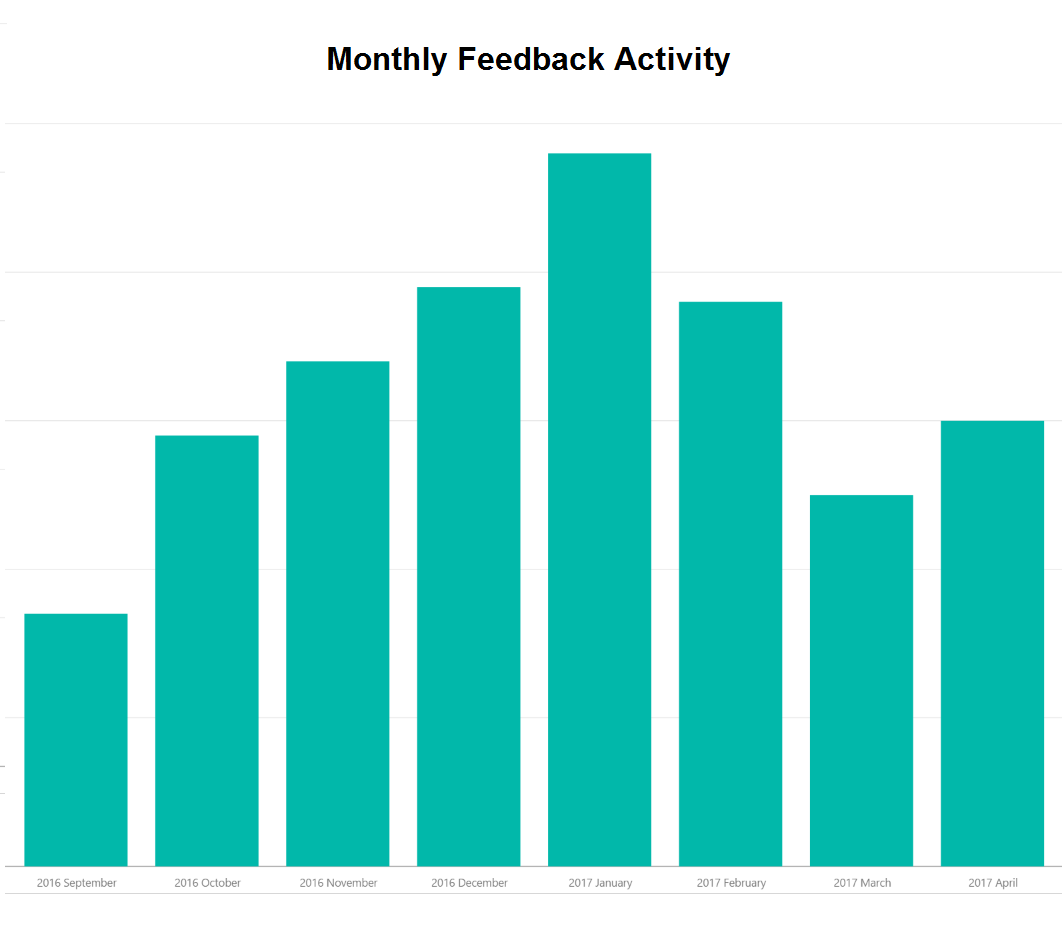
Example trend showing feedback frequency over time
The kinds of trends that future looking performance management relies upon are trends that show the impact a person is making to the business and to others, the readiness of individuals to take on more responsibility, the extent to which feedback is being sought for self-improvement and the momentum of that self-improvement.
Notice these are very different to trends like achievement of sales target, service level measures or production measures. In the large part, the difference is to switch to measuring inputs versus the traditional approach of measuring outcomes.
The difference is that a person usually has much greater control over their inputs, making input measures much less susceptible to external forces or defensible by excuses.
Insights
Insights involve analysing raw data to extract more value from it.
This might be from cross referencing data from multiple systems, or enriching data using 3rd party information and tools.
As an example the network address of someone using a web platform can be used to find insight about their location, removing the need to specifically ask for location and yet still allowing analysis of it.
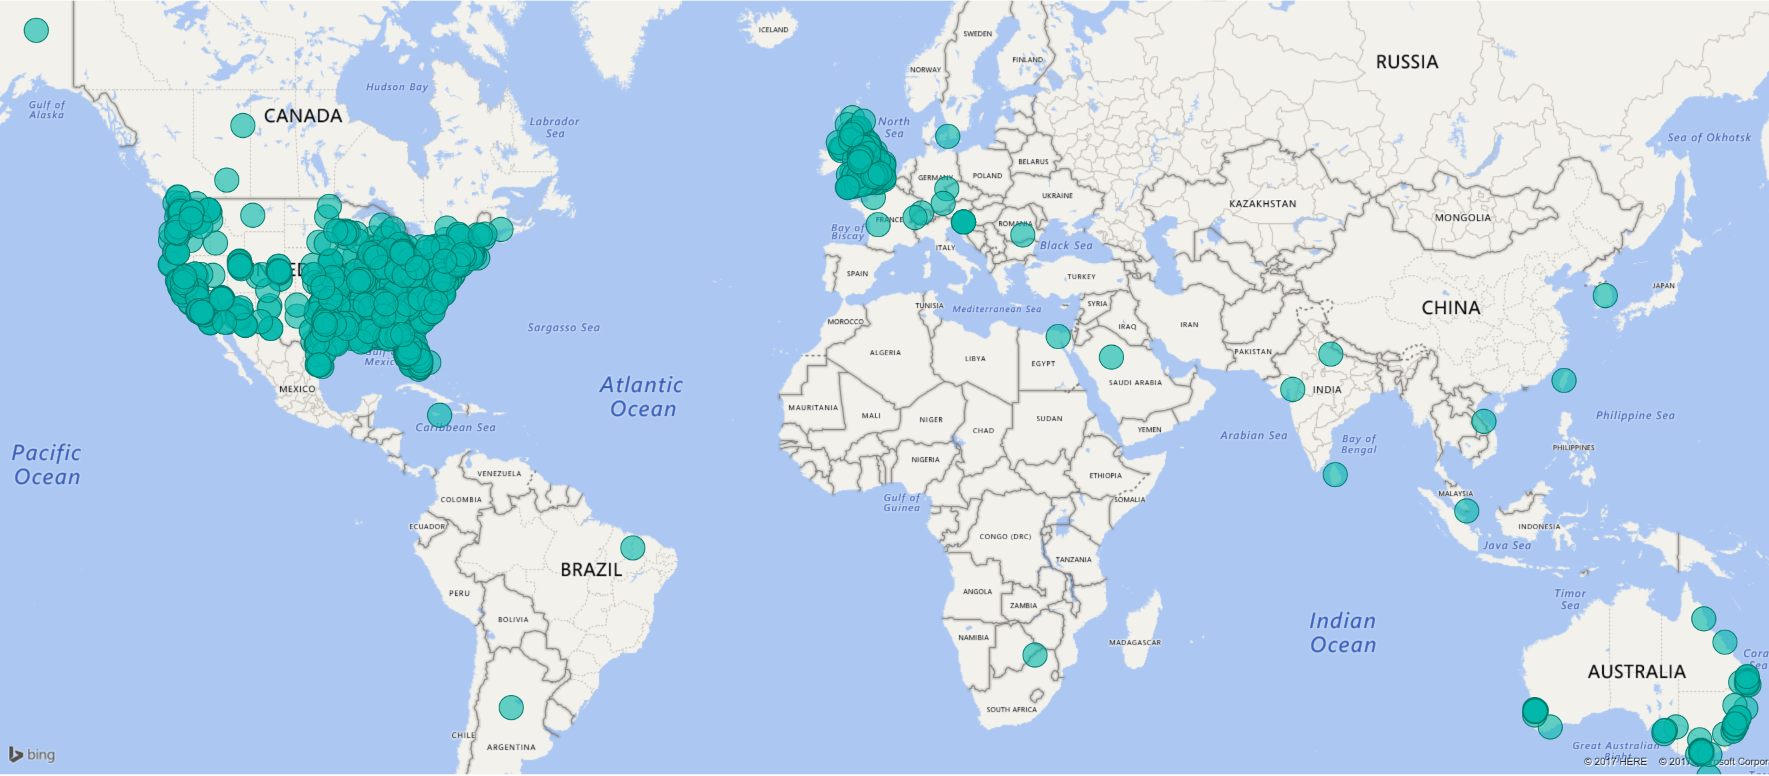
Example insight showing location of users without requesting their location directly
A hot topic right now is gender bias. Insights can help identify the gender dynamic of your organisation, and all manner of other diversity and inclusion insights.
For example what is the difference in the tendencies of males and females when initiating feedback conversations?
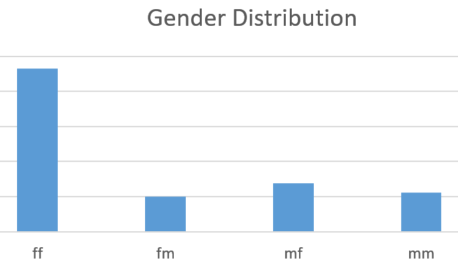
Example insight into the gender of initiator and recipient of feedback
Enrichment of raw data can get quite sophisticated. Algorithms can be used to turn natural language into sentiment scores to show how positive or negative the narrative is in your business or to identify managers that are too positive, too negative or too vague to be actually influencing performance rather than simply commenting on it.
Insights can also venture into the relationships that exist between people enabling Organisation Network Analytics (ONA) to be constructed. These can be very powerful to show who is engaged, who isn't and who is influencing within a team or across teams. ONA can assist in decision support for succession planning, reorganisations, merger & acquisition, diversity and inclusion and areas such as talent retention, mentoring assignments and change management.

Example insight - who are the connectors and outliers in the organisation
Insights are important to high performance culture because they are actionable. From each insight the best next action to achieve the behaviour that you want from the organisation can be found, even if that action is to drill deeper into the data to gain further clarity.
Are we nearly there yet?
All of these measures require data, and the more data that is captured the better the quality, breadth and depth of analysis that can take place.
Unrecorded conversations provide no data. Even when such conversations happen the opportunity for insight is missed.
Hence, when tabling the change from traditional to agile performance management, we recommend positioning the business value of greater insight into the people dynamics of the business rather than a cost saving from streamlining an admin heavy and low value legacy process.
The best case you can work towards is that a large majority of your people use a lightweight performance management system habitually, and become vested in their daily progress at work. Think of this being similar to how they might use Fitbit software or Strava to monitor and improve their fitness on a regular basis outside of work.
The team at Pay Compliment are supporting clients with Performance Management analytics by providing inbuilt dashboards, as well as custom reports. If you would like to know more, please contact us to find out what we can offer.